Create on canvas
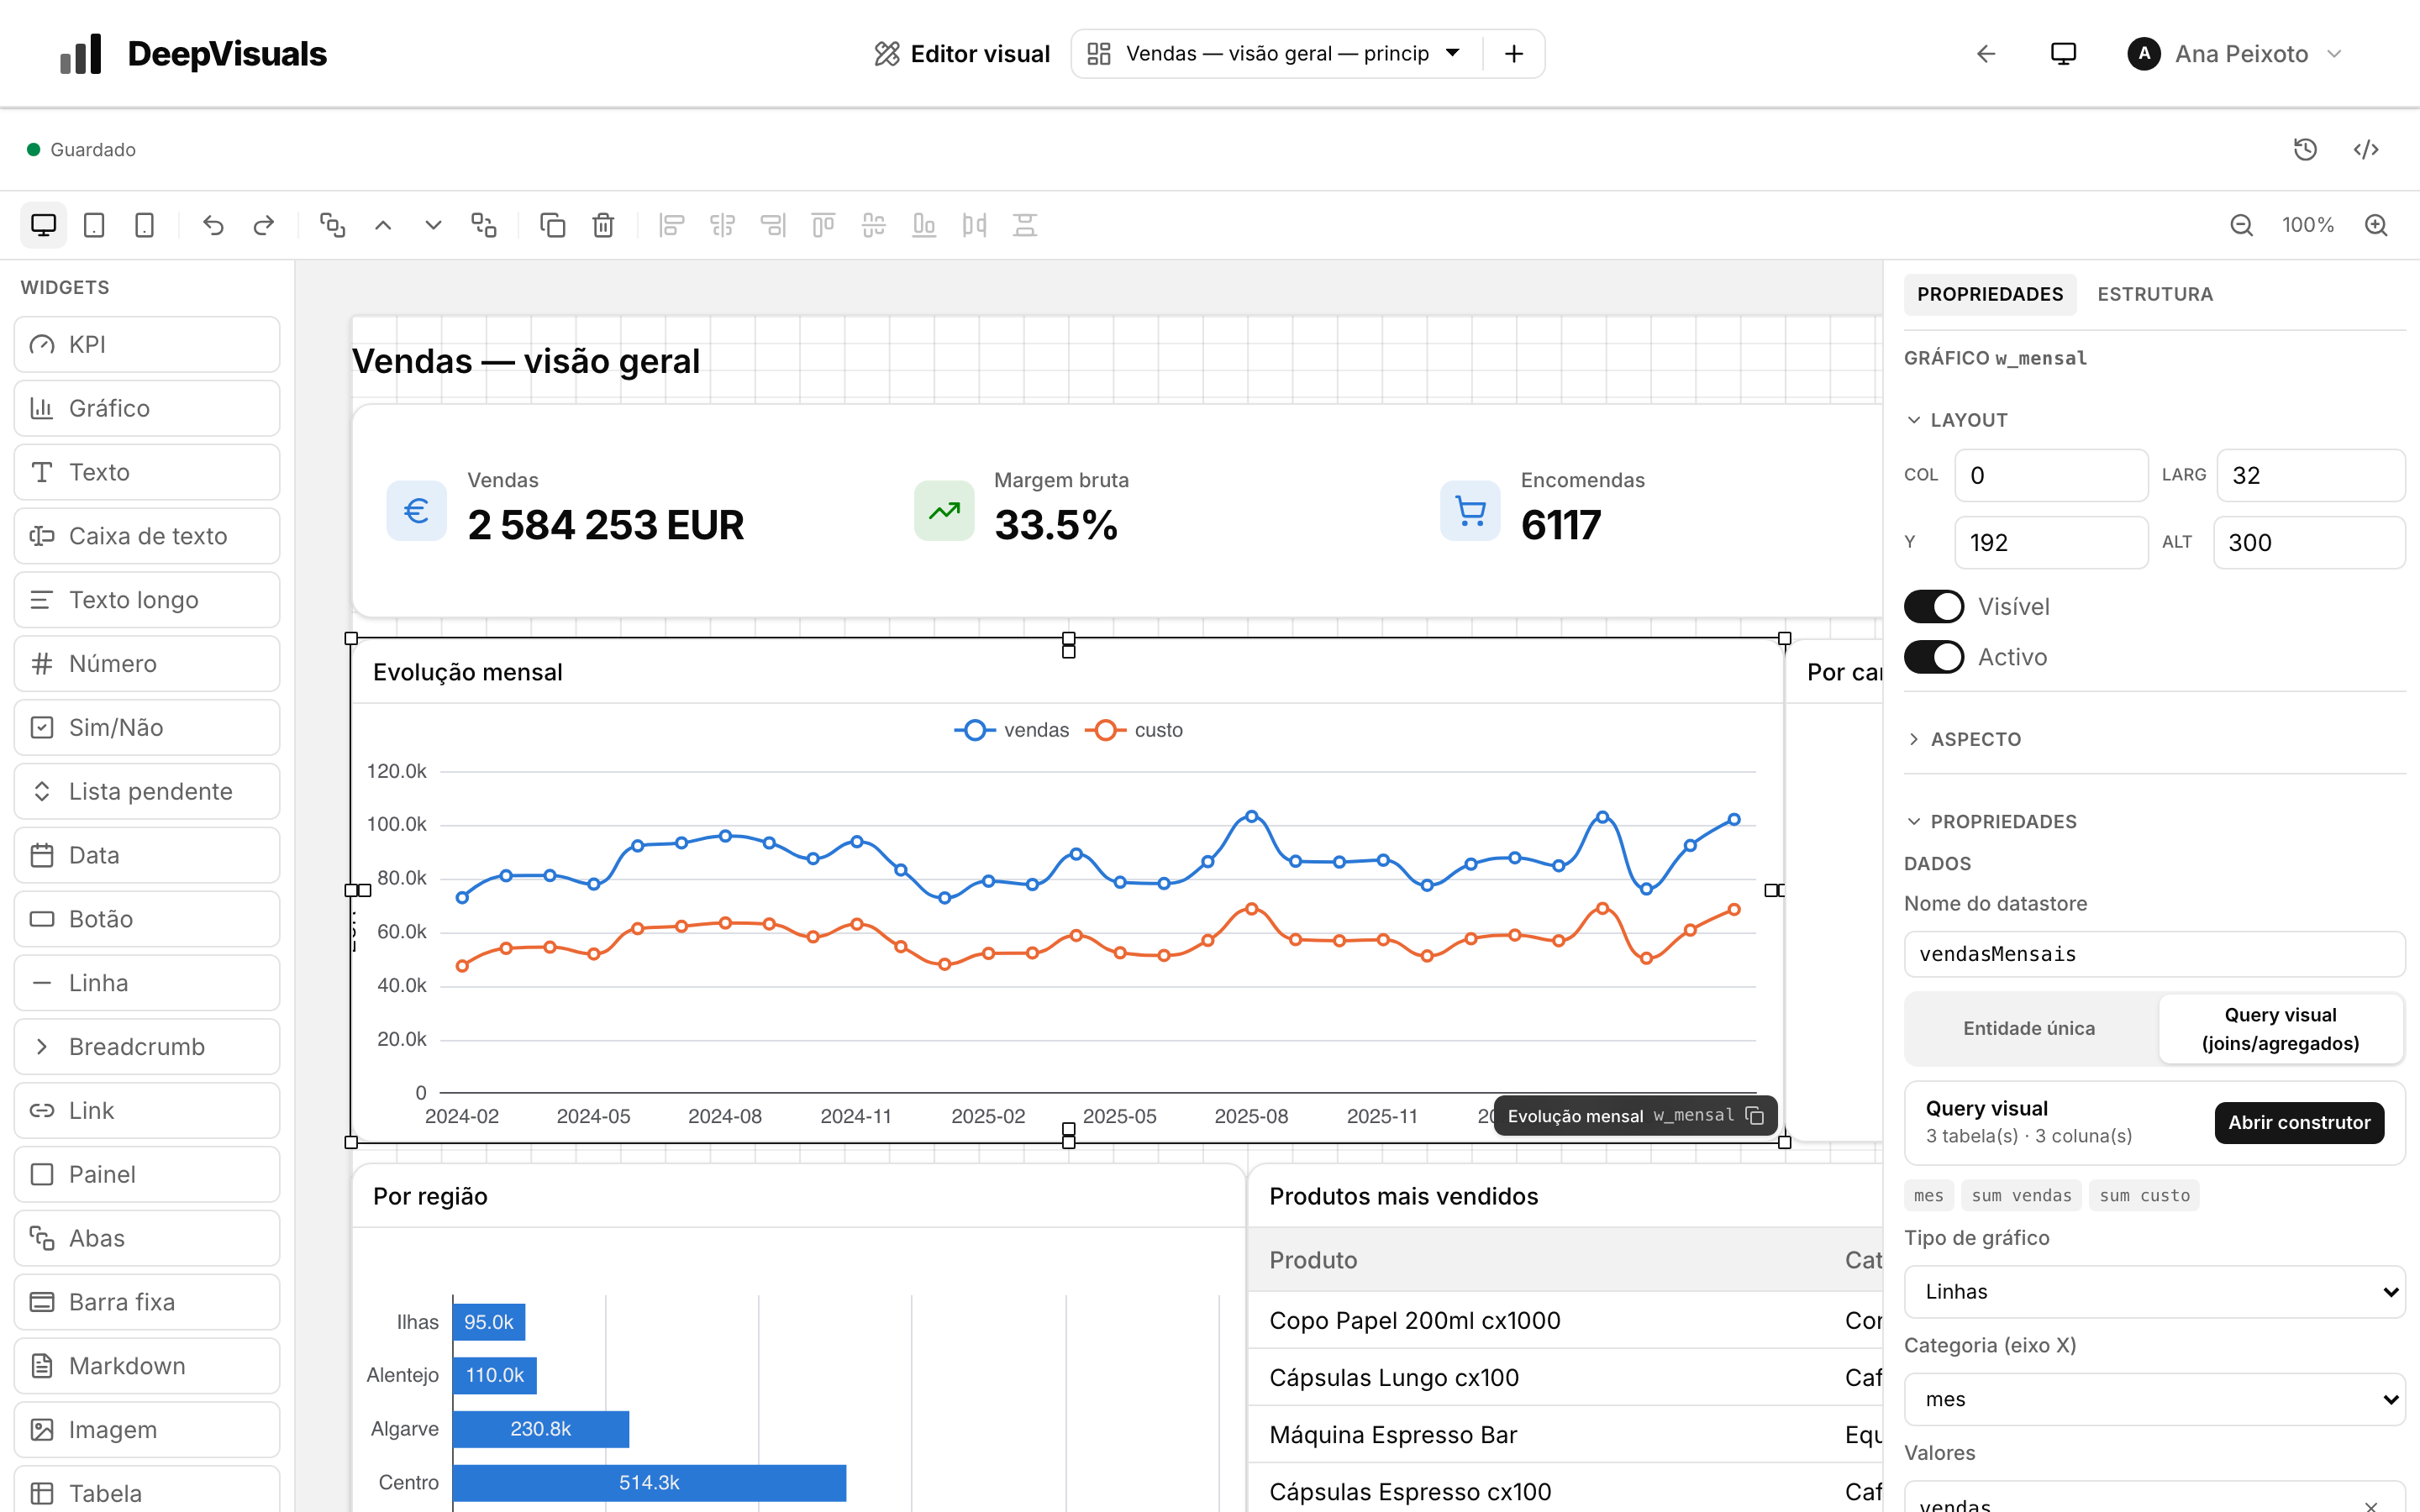
Drag a widget from the palette, place it on the grid and resize it with the handles.
 MAINSYSTEMS
DASHBOARDS
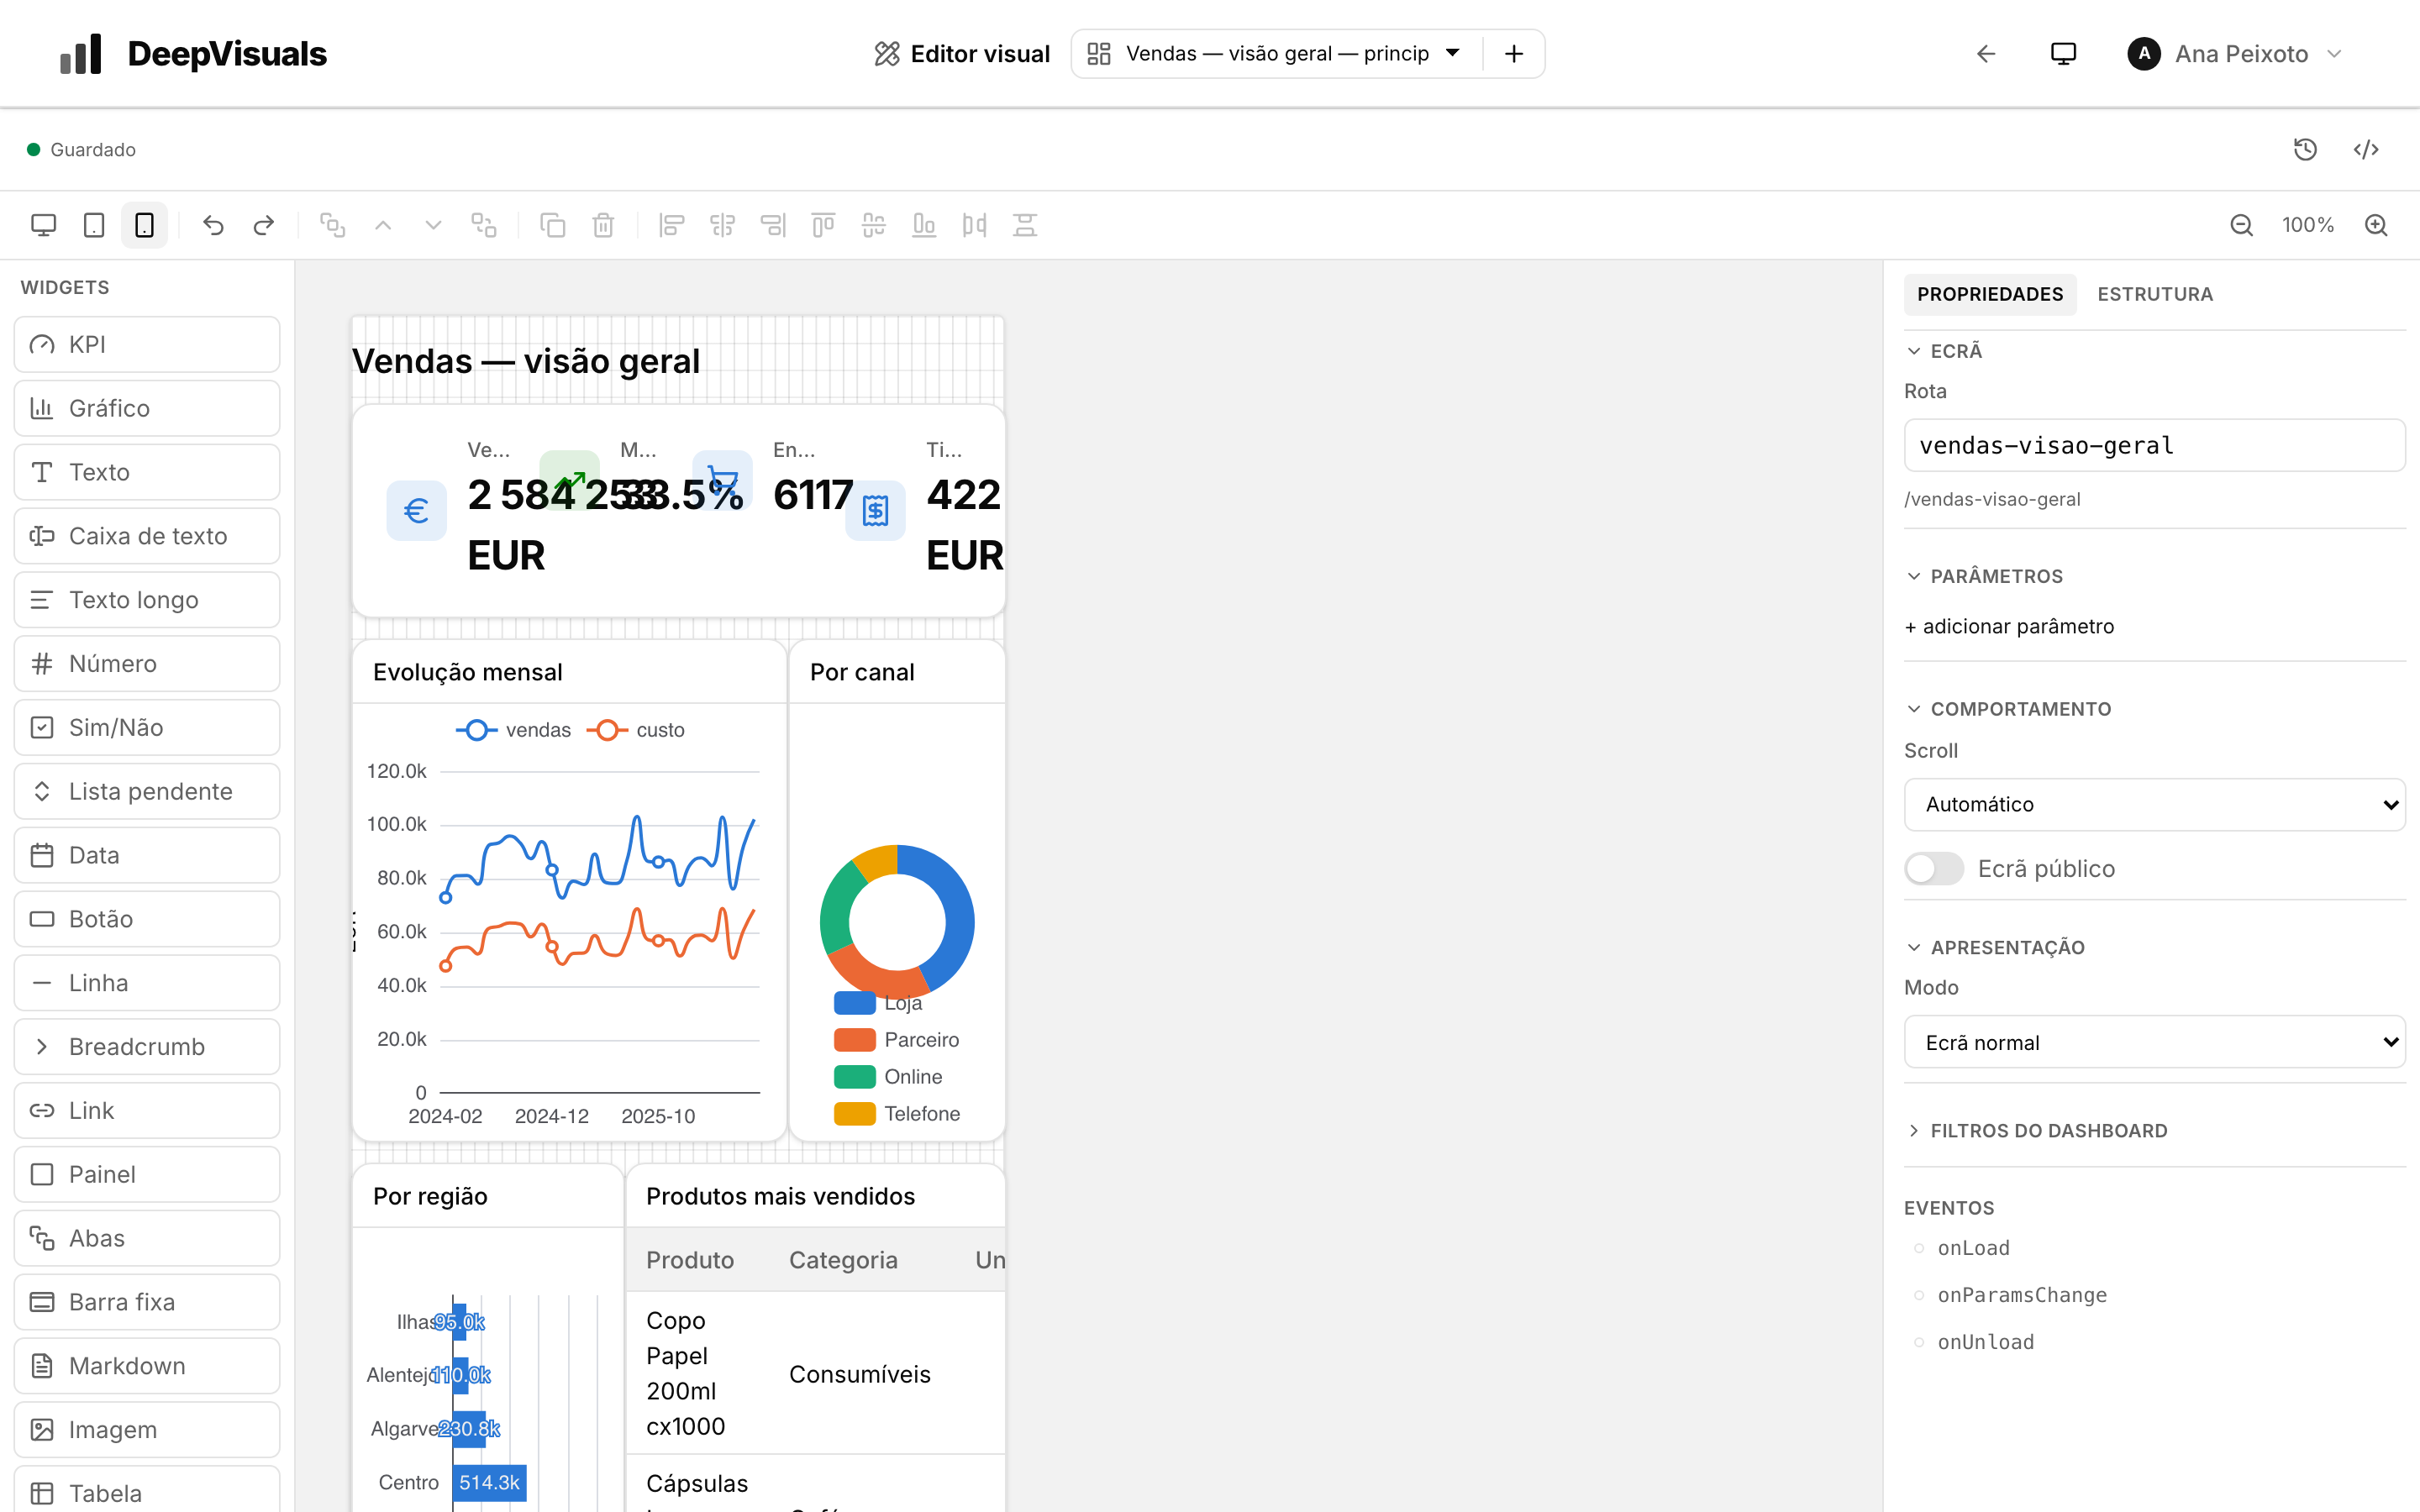
The palette creates the widget, the canvas shows the result and the inspector handles query, layout and style. The same page serves three screen sizes.
 EDITOR · PALETTE LEFT, INSPECTOR RIGHT
INSIDE THE PRODUCT
Drag a widget from the palette, place it on the grid and resize it with the handles.
Data, structure and appearance live in the side panel. Charts map result columns to axes and values.
Web is the base. Tablet and mobile store only position and size differences.
Screen filters, cross-filtering, drill-through and events let people explore without leaving the dashboard.